2. WHAT IS THE CURRENT FOOD SECURITY SITUATION AT THE NATIONAL LEVEL?
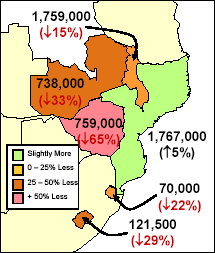
2001/02 Cereal Production (MT), compared to average

SOURCE: REWU, September 2002
|
Compared with the past five-year average, 2001/02 cereal production at the national level was down notably in the six countries included in the assessments, with the exception of Mozambique (see map). The most severe drop
was in Zimbabwe, where cereal production was 65% less than the national average. At the national level in Mozambique, production was up 5% as a result of
good rainfall and high production levels in key northern cereal producing areas. Production in southern and central drought affected areas of Mozambique was
down by as much as 34%, leading to localized food shortages.
Adding stock reserves with 2001/02 production provides an estimate of national cereal availability at the beginning of the 2002/03 marketing year
(April in most countries) (see table). Subtracting domestic cereal requirements (excluding desired closing
stocks), provides an indication of the domestic cereal gap, which must be filled through a combination of
commercial imports (including direct or subsidized imports by government) and food aid. Zimbabwe’s
domestic cereal gap this year of 1,654,000MT compares with the past five-year average of 156,000MT. The
cereal gap in Zambia is 147% higher than average, Swaziland 88%, Malawi 71%, Mozambique 61% and
Lesotho 40% higher. The table also shows import progress towards filling the cereal gap since the beginning
of the marketing year. Mozambique has made the most progress, having imported nearly 78% if its
requirements through a combination of commercial and food aid imports. Zambia has made the least
progress, having so far filled less than 9% of its cereal gap. All other countries have filled between 22% and 27% of the gap.
|
2002/03 Domestic Cereal Gap (MT) and Import Progress, September 2002
| |
2001/02 Cereal Production + Opening Stocks |
Domestic Requirements1 |
Domestic Cereal Gap |
Commercial Imports Received |
Food Aid Imports Received |
Remaining Cereal Gap/Surplus |
| Lesotho |
140,000 |
395,500 |
255,500 |
56,500 |
3,000 |
196,000 |
| Malawi2 |
1,847,000 |
2,124,000 |
277,000 |
42,000 |
24,000 |
211,000 |
| Mozambique |
1,876,000 |
2,256,000 |
380,000 |
233,000 |
63,000 |
84,000 |
| Swaziland |
72,500 |
193,500 |
121,000 |
28,000 |
5,000 |
88,000 |
| Zambia |
761,000 |
1,445,000 |
684,000 |
43,000 |
16,000 |
625,000 |
| Zimbabwe |
929,000 |
2,583,000 |
1,654,000 |
335,000 |
71,000 |
1,248,000 |
1. Excludes stock replenishment; 2. Includes cassava maize equivalent; SOURCE: National and Regional EWUs
For the six countries assessed, an estimated 14.4 million people are adversely affected by food shortages. These people risk
losing their livelihood assets. If conditions deteriorate further there could be widespread nutritional decline and the threat of
death. An estimated one million metric tonnes of emergency cereal food aid is required to assist the most vulnerable people
until the next main harvest in April/May.
Populations in Need of Emergency Food Aid and Cereal Requirements (MT) September 1, 2002 through March 31, 2003
(Numbers are rounded)
| |
Max No. of People in Need |
Max % of Total Population |
Cumulative Requirements |
| Zimbabwe |
6,700,000 |
49% |
486,000 MT |
| Malawi |
3,300,000 |
29% |
237,000 MT |
| Zambia |
2,900,000 |
26% |
224,000 MT |
| Lesotho |
650,000 |
30% |
36,000 MT |
| Swaziland |
270,000 |
24% |
20,000 MT |
| Mozambique |
590,000 |
3% |
48,000 MT |
| TOTAL |
14,400,000 |
25% |
1,000,000 MT |
Zimbabwe stands out as having the greatest number of people in need of food
assistance (6.7 million), representing 49% of the national population. Zimbabwe will require almost half of the overall metric tonnes of emergency
cereal for the region (486,000 out of the 1 million MT total). Malawi and Zambia also have high overall
numbers of people in need (3.3 and 2.9 million, respectively). While the absolute numbers of those requiring
assistance in Lesotho and Swaziland are notably lower, the relatively high percentages of their population in
need of food assistance (30% and 24%, respectively) are indicative of the crisis severity. In Mozambique,
the overall percentage of the total population in need is low (3%), but that
number obscures the level of need within the most seriously affected districts.
Within each country the assessments provide targeting information to assist in reaching the most vulnerable groups, including geographic, temporal, and socioeconomic
targeting. The map on the previous page illustrates variations of need at the district levels. Temporal targeting refers to the increasing levels of need
up until the next main harvest in April/May. From September through November, there are an estimated 10 million people in need of food assistance, which will increase to 14.4 million from December through March 2003. Rural households that are most vulnerable
are typically characterized by being female headed, having orphans, having few to no livestock, and small land holdings.
|


